In this post, we will see how to use the Charts framework added in SwiftUI 4.
But first of all, what is Charts?
From Apple developer site:
“Swift Charts is a powerful and concise SwiftUI framework for transforming your data into informative visualizations. With Swift Charts, you can build effective and customizable charts with minimal code. This framework provides marks, scales, axes, and legends as building blocks that you can combine to develop a broad range of data-driven charts.”
In a nutshell, the Charts framework helps us to create charts in a simple way.
To better understand it, we will create an application in which we will display weekly temperatures using five types of charts: Vertical/Horizontal Bar chart, Line chart, Point chart, and Area chart.
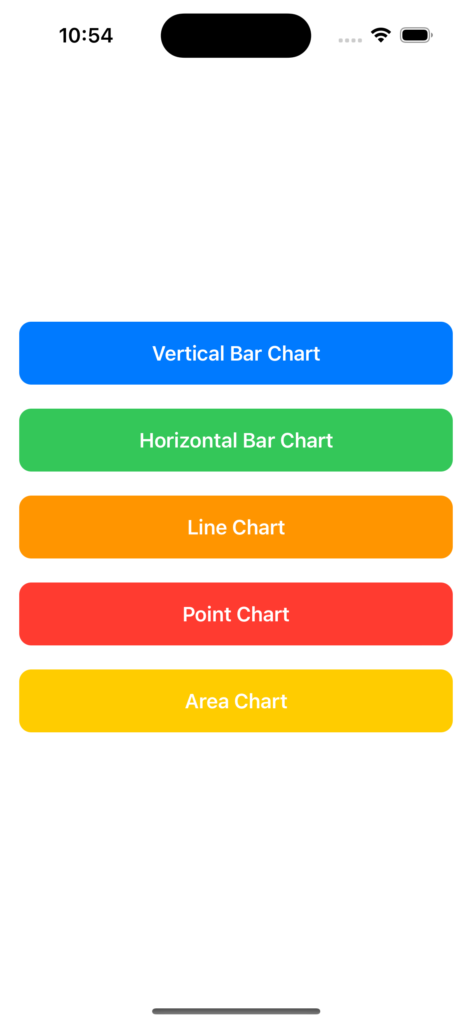
Let’s start opening Xcode and we create an IOS App project called TestCharts where, we will define a menu like this:
[CONTENTVIEW.SWIFT]
import SwiftUI

struct ContentView: View {
    var body: some View {
        VStack(spacing: 20) {
            Button(action: {
                // Action for button 1
            }) {
                Text("Vertical Bar Chart")
                    .font(.headline)
                    .foregroundColor(.white)
                    .padding()
                    .frame(maxWidth: .infinity)
                    .background(Color.blue)
                    .cornerRadius(10)
            }

            Button(action: {
                // Action for button 2
            }) {
                Text("Horizontal Bar Chart")
                    .font(.headline)
                    .foregroundColor(.white)
                    .padding()
                    .frame(maxWidth: .infinity)
                    .background(Color.green)
                    .cornerRadius(10)
            }

            Button(action: {
                // Action for button 3
            }) {
                Text("Line Chart")
                    .font(.headline)
                    .foregroundColor(.white)
                    .padding()
                    .frame(maxWidth: .infinity)
                    .background(Color.orange)
                    .cornerRadius(10)
            }

            Button(action: {
                // Action for button 4
            }) {
                Text("Point Chart")
                    .font(.headline)
                    .foregroundColor(.white)
                    .padding()
                    .frame(maxWidth: .infinity)
                    .background(Color.red)
                    .cornerRadius(10)
            }

            Button(action: {
                // Action for button 5
            }) {
                Text("Area Chart")
                    .font(.headline)
                    .foregroundColor(.white)
                    .padding()
                    .frame(maxWidth: .infinity)
                    .background(Color.yellow)
                    .cornerRadius(10)
            }
        }
        .padding()
        .frame(maxWidth: .infinity, maxHeight: .infinity, alignment: .center)
    }
}


struct ContentView_Previews: PreviewProvider {
    static var previews: some View {
        ContentView()
    }
}
If we run the application, the following will be the result:
Now, we define the Model and the ModelView that we will use in all charts.
[TEMPERATURE.SWIFT] – Model
import Foundation

struct Temperature: Identifiable {
    let id = UUID()
    let day: String
    let degree: Int
}
[TEMPERATUREVIEWMODEL.SWIFT] – ViewModel
import Foundation

class TemperatureViewModel {

    private var lstTemperature = [Temperature]()

    // constructor
    init() {
        lstTemperature.append(Temperature(day: "Monday", degree: 10))
        lstTemperature.append(Temperature(day: "Tuesday", degree: 8))
        lstTemperature.append(Temperature(day: "Wednesday", degree: 7))
        lstTemperature.append(Temperature(day: "Thursday", degree: 10))
        lstTemperature.append(Temperature(day: "Friday", degree: 12))
        lstTemperature.append(Temperature(day: "Saturday", degree: 11))
        lstTemperature.append(Temperature(day: "Sunday", degree: 9))
    }

    func GetTemperatures() -> [Temperature] {
        return lstTemperature
    }
}
Then, we create a View for every single chart:
[VERTICALBARVIEW.SWIFT]
import SwiftUI
import Charts

struct VerticalBarView: View {
    @State var objTemperatures = TemperatureViewModel()
    var body: some View {
        VStack {
            Text("Weekly Temperatures")
            // 1. Add a chart element
            Chart(objTemperatures.GetTemperatures()) { item in
                // 2. Bar mark
                BarMark(
                    x: .value("Day", item.day),
                    y: .value("Degree", item.degree)
                )
                .annotation {
                    Text("\(item.degree)°")
                }
            }
        }
        .padding()
    }
}

struct VerticalBarView_Previews: PreviewProvider {
    static var previews: some View {
        VerticalBarView()
    }
}
[HORIZONTALBARVIEW.SWIFT]
import SwiftUI
import Charts

struct HorizontalBarView: View {
    @State var objTemperatures = TemperatureViewModel()
    var body: some View {
        VStack {
            Text("Weekly Temperatures")
            // 1. Add a chart element
            Chart(objTemperatures.GetTemperatures()) { item in
                // 2. Bar mark
                BarMark(
                    x:.value("Degree", item.degree),
                    y: .value("Day", item.day)
                )
                .annotation {
                    Text("\(item.degree)°")
                }
            }
        }
        .padding()
    }
}

struct HorizontalBarView_Previews: PreviewProvider {
    static var previews: some View {
        HorizontalBarView()
    }
}
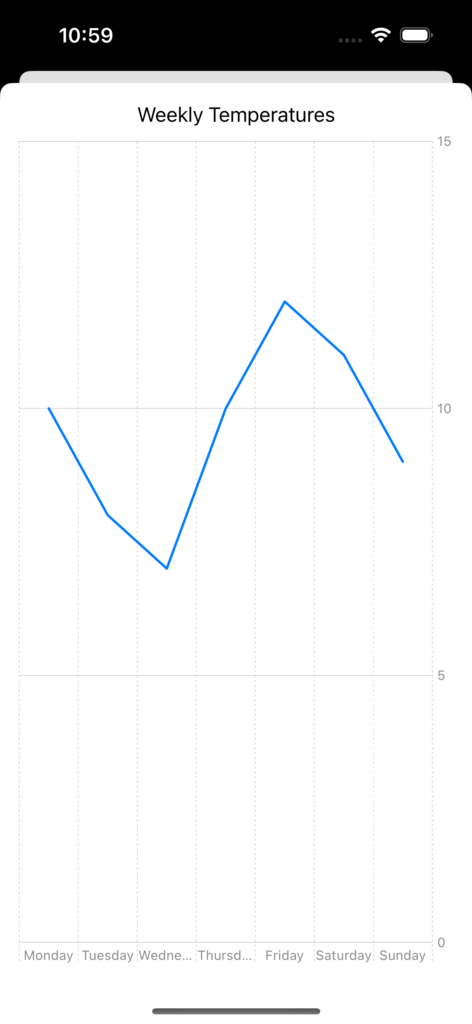
[LINECHARTVIEW.SWIFT]
import SwiftUI
import Charts

struct LineChartView: View {
    @State var objTemperatures = TemperatureViewModel()
    var body: some View {
        VStack {
            Text("Weekly Temperatures")
            // 1. Add a chart element
            Chart(objTemperatures.GetTemperatures()) { item in
                // 2. Line mark
                LineMark(
                    x: .value("Day", item.day),
                    y: .value("Degree", item.degree)
                )
                .annotation {
                    Text("\(item.degree)°")
                }
            }
        }
        .padding()
    }
}

struct LineChartView_Previews: PreviewProvider {
    static var previews: some View {
        LineChartView()
    }
}
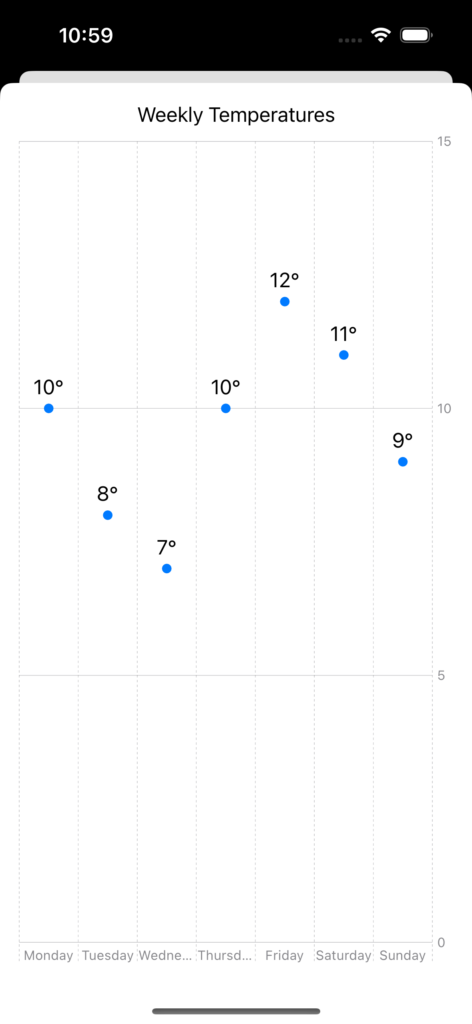
[POINTCHARTVIEW.SWIFT]
import SwiftUI
import Charts

struct PointChartView: View {
    @State var objTemperatures = TemperatureViewModel()
    var body: some View {
        VStack {
            Text("Weekly Temperatures")
            // 1. Add a chart element
            Chart(objTemperatures.GetTemperatures()) { item in
                // 2. Point mark
                PointMark(
                    x: .value("Day", item.day),
                    y: .value("Degree", item.degree)
                )
                .annotation {
                    Text("\(item.degree)°")
                }
            }
        }
        .padding()
    }
}

struct PointChartView_Previews: PreviewProvider {
    static var previews: some View {
        PointChartView()
    }
}
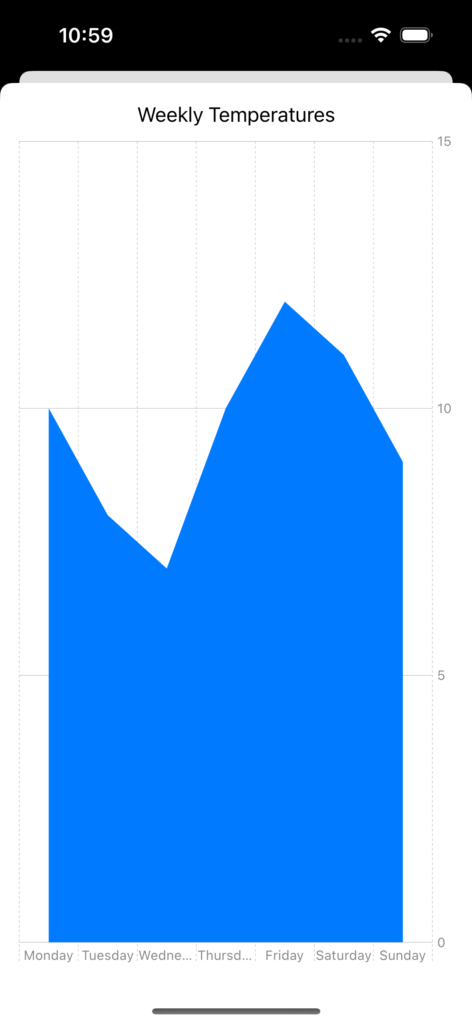
[AREACHARTVIEW.SWIFT]
import SwiftUI
import Charts

struct AreaChartView: View {
    @State var objTemperatures = TemperatureViewModel()
    var body: some View {
        VStack {
            Text("Weekly Temperatures")
            // 1. Add a chart element
            Chart(objTemperatures.GetTemperatures()) { item in
                // 2. Area mark
                AreaMark(
                    x: .value("Day", item.day),
                    y: .value("Degree", item.degree)
                )
            }
        }
        .padding()
    }
}

struct AreaChartView_Previews: PreviewProvider {
    static var previews: some View {
        AreaChartView()
    }
}
Finally, we modify the ContentView file:
[CONTENTVIEW.SWIFT]
import SwiftUI

struct ContentView: View {
    @State private var showVerticalBar = false
    @State private var showHorizontalBar = false
    @State private var showLineChart = false
    @State private var showPointChart = false
    @State private var showAreaChart = false
    var body: some View {
        VStack(spacing: 20) {
            Button(action: {
                self.showHorizontalBar = false
                self.showLineChart = false
                self.showAreaChart = false
                self.showVerticalBar.toggle()
            }) {
                Text("Vertical Bar Chart")
                    .font(.headline)
                    .foregroundColor(.white)
                    .padding()
                    .frame(maxWidth: .infinity)
                    .background(Color.blue)
                    .cornerRadius(10)
            }

            Button(action: {
                self.showVerticalBar = false
                self.showLineChart = false
                self.showPointChart = false
                self.showAreaChart = false
                self.showHorizontalBar.toggle()
            }) {
                Text("Horizontal Bar Chart")
                    .font(.headline)
                    .foregroundColor(.white)
                    .padding()
                    .frame(maxWidth: .infinity)
                    .background(Color.green)
                    .cornerRadius(10)
            }

            Button(action: {
                self.showVerticalBar = false
                self.showHorizontalBar = false
                self.showPointChart = false
                self.showAreaChart = false
                self.showLineChart.toggle()
            }) {
                Text("Line Chart")
                    .font(.headline)
                    .foregroundColor(.white)
                    .padding()
                    .frame(maxWidth: .infinity)
                    .background(Color.orange)
                    .cornerRadius(10)
            }

            Button(action: {
                self.showVerticalBar = false
                self.showHorizontalBar = false
                self.showLineChart = false
                self.showAreaChart = false
                self.showPointChart.toggle()
            }) {
                Text("Point Chart")
                    .font(.headline)
                    .foregroundColor(.white)
                    .padding()
                    .frame(maxWidth: .infinity)
                    .background(Color.red)
                    .cornerRadius(10)
            }
            Button(action: {
                self.showVerticalBar = false
                self.showHorizontalBar = false
                self.showLineChart = false
                self.showPointChart = false
                self.showAreaChart.toggle()
            }) {
                Text("Area Chart")
                    .font(.headline)
                    .foregroundColor(.white)
                    .padding()
                    .frame(maxWidth: .infinity)
                    .background(Color.yellow)
                    .cornerRadius(10)
            }
        }
        .padding()
        .frame(maxWidth: .infinity, maxHeight: .infinity, alignment: .center)

        .sheet(isPresented: $showVerticalBar) {
                        VerticalBarView()
                    }
        .sheet(isPresented: $showHorizontalBar) {
                    HorizontalBarView()
                    }
        .sheet(isPresented: $showLineChart) {
                    LineChartView()
                    }
        .sheet(isPresented: $showPointChart) {
                    PointChartView()
                    }
        .sheet(isPresented: $showAreaChart) {
                    AreaChartView()
                    }
    }
}


struct ContentView_Previews: PreviewProvider {
    static var previews: some View {
        ContentView()
    }
}
We have done and now, if we run the application, the following will be the result:
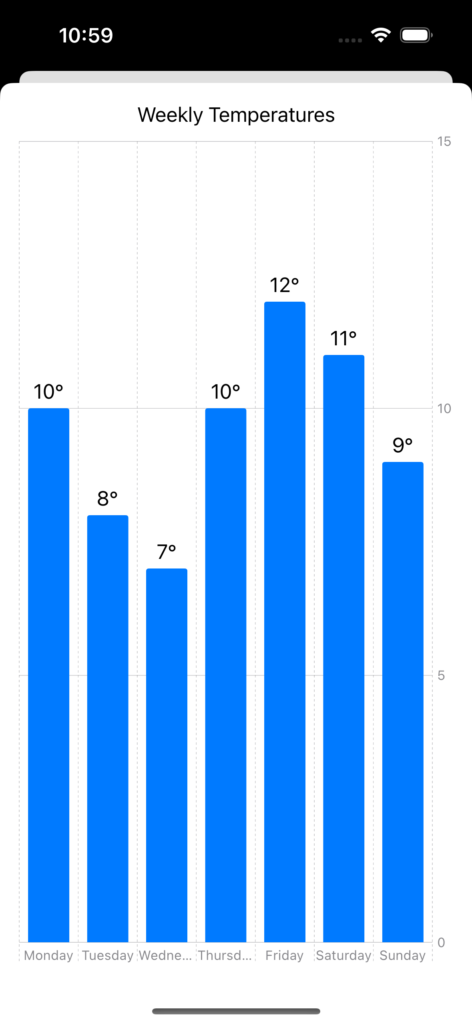
VERTICAL BAR CHART
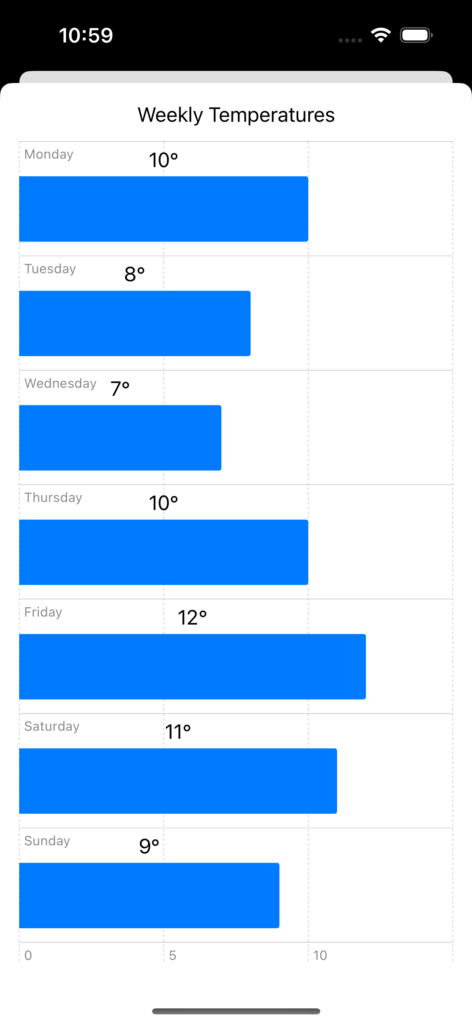
HORIZONTAL BAR CHART
LINE CHART
POINT CHART
AREA CHART