In this post, we will see how to create a Pie Chart using new mark type called SectorMark introduced in iOS 17.0.
For this post, we will visualize a simple monthly budget allocation using different spending categories such as Housing, Food, Transportation, Entertainment, and Savings.
We start to define the Data Model:
[BUDGETDATA.SWIFT]
import SwiftUI

struct BudgetData: Identifiable {
    let id = UUID()
    let category: String
    let amount: Double
}
Then, we define the ViewModel:
[BUDGETDATAVIEWMODEL.SWIFT]
import Foundation

class BudgetDataViewModel {
    private var lstItems = [BudgetData]()

    // constructor
    init() {
        lstItems.append(BudgetData(category: "Housing", amount: 1200))
        lstItems.append(BudgetData(category: "Food", amount: 600))
        lstItems.append(BudgetData(category: "Transportation", amount: 300))
        lstItems.append(BudgetData(category: "Entertainment", amount: 200))
        lstItems.append(BudgetData(category: "Savings", amount: 700))
    }

    func GetData() -> [BudgetData] {
        return lstItems
    }
}
Finally, we define some views to show some Pie Chart customizations:
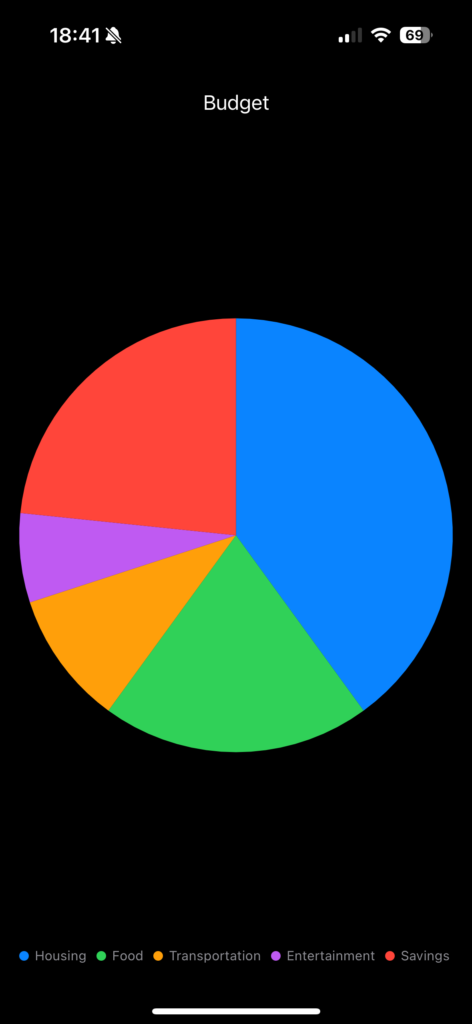
[VIEW_1]
import SwiftUI
import Charts

struct ContentView: View {
    @State var objCore = BudgetDataViewModel()
    var body: some View {
        VStack {
            Text("Budget")
            Chart(objCore.GetData()) { item in
                SectorMark(angle: .value("Amount", item.amount))
                    .foregroundStyle(by: .value("Category", item.category))
            }
        }
        .padding()
    }
}

#Preview {
    ContentView()
}
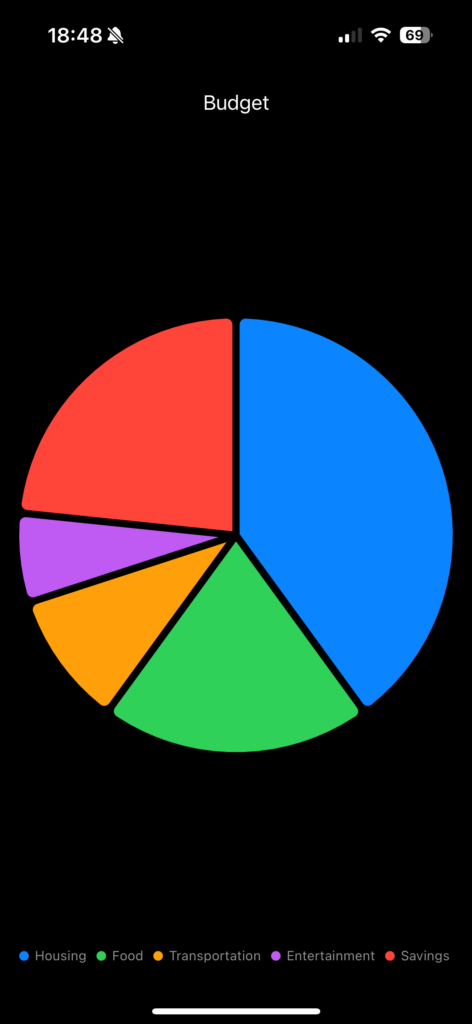
[VIEW_2]
import SwiftUI
import Charts

struct ContentView: View {
    @State var objCore = BudgetDataViewModel()
    var body: some View {
        VStack {
            Text("Budget")
            Chart(objCore.GetData()) { item in
                SectorMark(
                    angle: .value("Amount", item.amount),
                    angularInset: 3.0
                )
                .cornerRadius(5.0)
                .foregroundStyle(by: .value("Category", item.category))
            }
        }
        .padding()
    }
}

#Preview {
    ContentView()
}
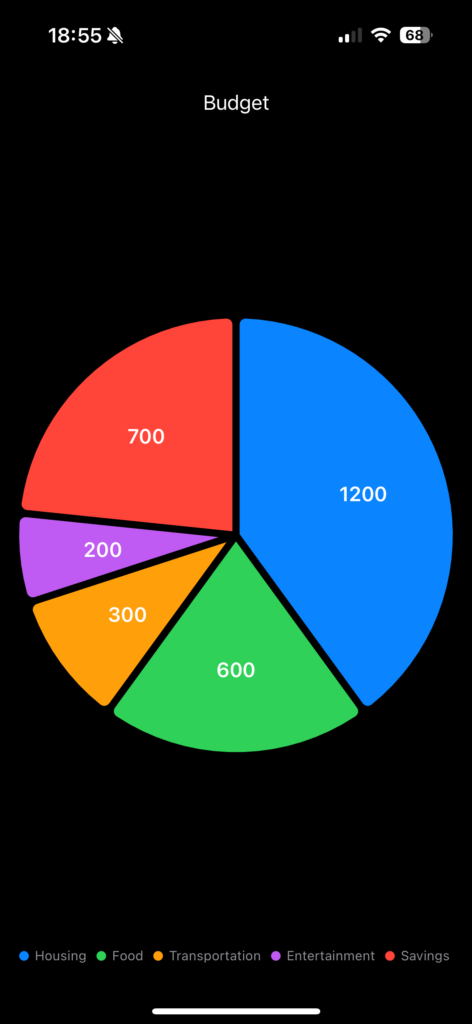
[VIEW_3]
import SwiftUI
import Charts

struct ContentView: View {
    @State var objCore = BudgetDataViewModel()
    var body: some View {
        VStack {
            Text("Budget")
            Chart(objCore.GetData()) { item in
                SectorMark(
                    angle: .value("Amount", item.amount),
                    angularInset: 3.0
                )
                .cornerRadius(5.0)
                .foregroundStyle(by: .value("Category", item.category))
                .annotation(position: .overlay) {
                    Text(String(format: "%.0f", item.amount))
                        .font(.headline)
                        .foregroundStyle(.white)
                }
            }
        }
        .padding()
    }
}

#Preview {
    ContentView()
}
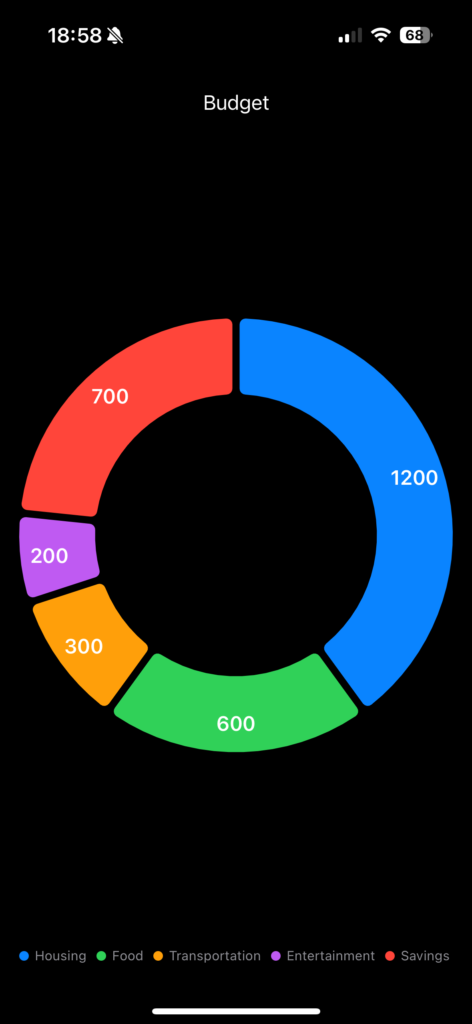
[VIEW_4]
import SwiftUI
import Charts

struct ContentView: View {
    @State var objCore = BudgetDataViewModel()
    var body: some View {
        VStack {
            Text("Budget")
            Chart(objCore.GetData()) { item in
                SectorMark(
                    angle: .value("Amount", item.amount),
                    innerRadius: .ratio(0.65),
                    angularInset: 3.0
                )
                .cornerRadius(5.0)
                .foregroundStyle(by: .value("Category", item.category))
                .annotation(position: .overlay) {
                    Text(String(format: "%.0f", item.amount))
                        .font(.headline)
                        .foregroundStyle(.white)
                }
            }
        }
        .padding()
    }
}

#Preview {
    ContentView()
}